According to the official data released by JD.com, from 0:00 on November 1, 2019 to 9:00 a.m. on November 11, 2019, the cumulative order amount of the "11.11 JD.com Global Good Products Festival" exceeded 165.8 billion yuan. First of all, congratulations to the platform for achieving such a good record. Good results are inseparable from any friends who are fighting late at night!
JD.com’s internal data-based core, understand that in-depth analysis of the internal data, you will find that your cost will be reduced a lot, whether in category strategy or promotion planning, you can save time. So today, let’s share an article on how to search the core data of each category for analysis and then analyze it.

1. JD search page transaction volume
Three years ago, we all knew that JD APP transactions accounted for 75%. Now we know that APP transactions accounted for 98%, which basically stayed on the mobile terminal. Then three years ago, we used PC transactions to make page transaction volume. Today, we don’t know what the APP page transactions accounted for, and what the overall official data is. APP has ten seats per page, and it is not a PC page with 60 seats per page. Then, the overall JD big data calculates the overall page transaction ratio, how much does the first page account for, the second page account for, and the first ten pages account for, we currently need an intuitive data to see through, so this is to first understand the essence of the JD page, and then optimize and increase orders. In this way, you have a great grasp of the first few positions on the homepage. Then the overall page transaction volume is monitored by JD through point-of-point data, which is a bit similar to the heat map we use. Simply use a table to present it to you to see the transaction volume page.

[JD APP page screenshot basketball keywords]

[JD Basketball Category APP transaction and retrieval data]
Then based on the data we retrieved above, we basically have the transaction proportion, and then you can check the data in the following step. Check out the pit number and pit conversion rate of each position so that you can basically surpass your opponent.
2. JD.com search data visualization
After understanding the position of proportion, we need to know the sales volume, complete the proportion of search and non-search, understand which port is the most orders on mobile phones, and so on, and then finally understand the age group of competitors to determine where the age group is promoted, and how to know yourself and your enemy and never win. So let’s analyze it through tools, for example, I want to analyze a yogurt machine category. First of all, the biggest keyword [yogurt machine] is needed.
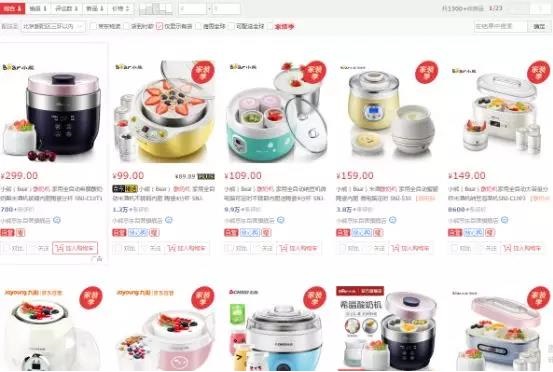
Enter the SKU into the table through the APP, and then use the APP display rules to put it into the SKU, because in the end you have to distinguish the products on the first page of the APP, and then copy the SKU to the software for a query. For example, we check the product sales of the first position of the APP.
first step:

Step 2:
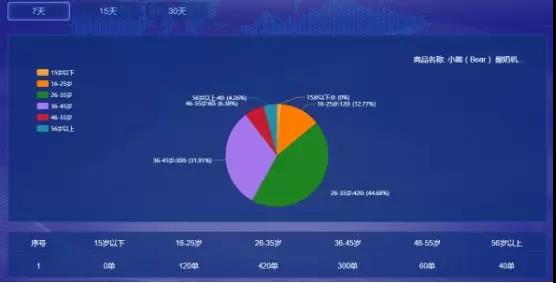
I learned about the age of orders and how many orders I placed, this SKU. Then even if the first product is collected, the station ratio of our acquisition port will be more accurate.
first step:

Step 2:
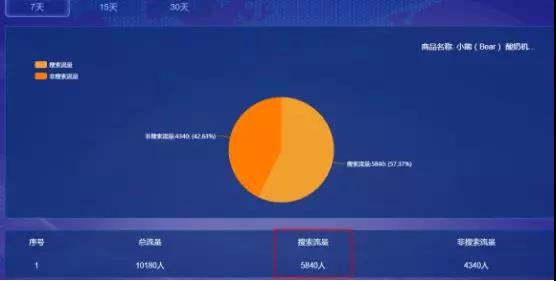
Then after tracking the traffic and order volume of this item, make the next one:

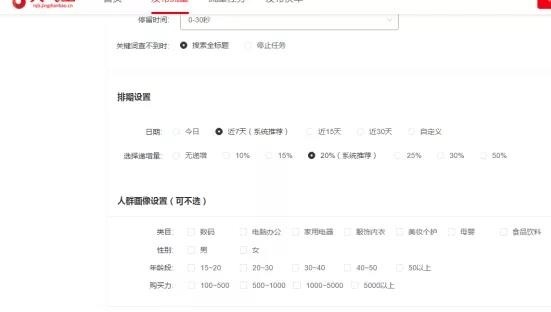
Then you can make a table similar to this, so that you can basically analyze your industry thoroughly, and so on, and then perform the second one below the first page, and then calculate the outbound ratio based on the total number of totals, and you are basically very accurate. So there is data on competitors. What kind of seat is used to make and disassemble what kind of single products in 30 days? But everyone should remember to control popularity when making improvement plans and balance visitors. Then implant a popular release:


![#Laogao E-commerce Newsletter# [E-commerce Morning News on December 12]](/update/1513042168l083586264.jpg)

 EN
EN CN
CN
