During the store activities, you will definitely encounter the following problems:
Before and after the big promotion, the store issued a large number of coupons, but what is the conversion rate? Which coupon is the best? There is no way to know!
During Double 11, what changes will the SKU of the main products change? Which SKU may be out of code and stock? Difficult to monitor!
Targets were set before the event, and even refined to every hour, but when it comes to the event, is it very troublesome to count time segments?
If you want to compare it with previous activities in a time-division manner, you still have to pull the previous data, which is time-consuming and labor-intensive?
If you have ever been puzzled by the above issues, the newly upgraded Data War Room 3.0 will help you solve these troubles.
Here we will select one of the functional modules of the data war room, "Activity Battle", to introduce in detail what new functions have been added to this upgrade of this module, and what powerful functions are included in the entire module!
Upgrade highlight 1: Added marketing tool module, and the store coupon effect is clear at a glance
Access path: Business Staff - War Room - Event Analysis - Marketing Tools
Whether it is a full or a direct reduction, doing activities is always inseparable from store coupons. But, if you distribute a bunch of coupons, how will it end?
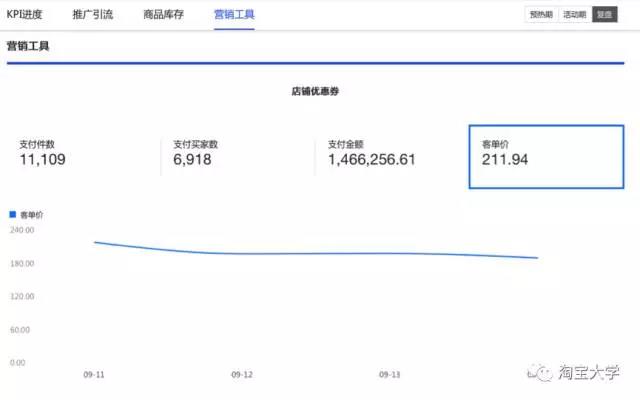
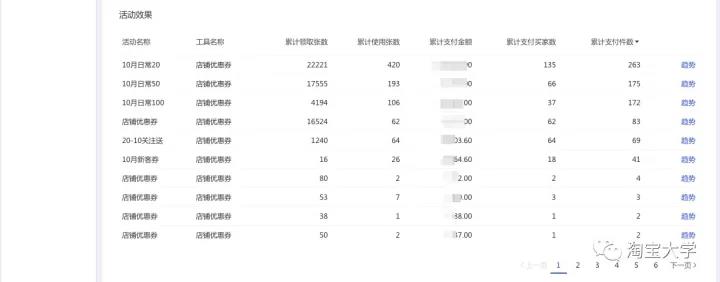
The upgraded event analysis will provide you with the conversion of store coupons created at different stages of the event, including the number of payments, the number of buyers paid, the amount of payment, and the unit price. In addition, it also supports comparison of coupons in different stores. It is clear which type of coupons are the most popular among customers and the best conversion situation. With this magical artifact, during Double 11, the operation can know which type of store has the highest coupon conversion rate!

Upgrade highlight 2: Added hourly monitoring, and more support for horizontal comparison of multiple activities
Access path: Business Staff - War Room - Activity Analysis - KPI Progress - Activity Effects Hourly Data
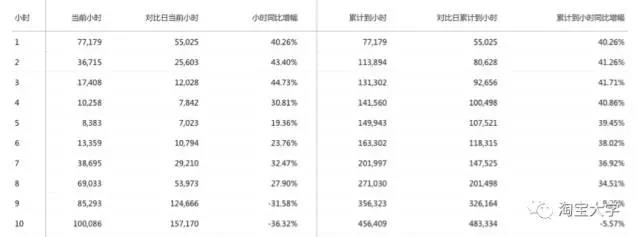
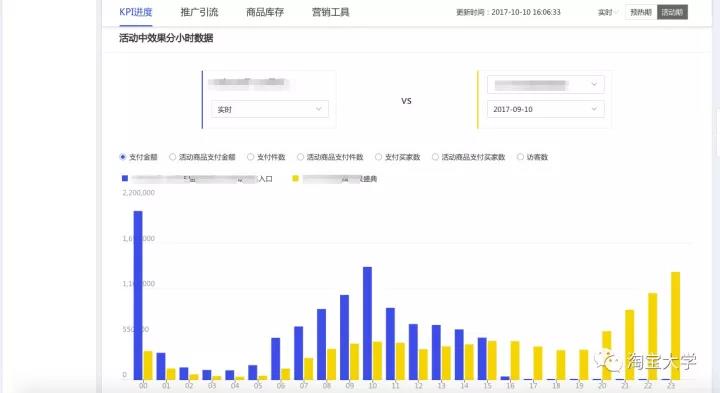
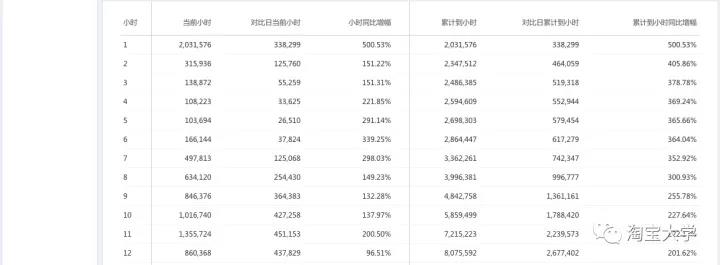
For every event, especially large-scale events such as Double 11 and 99 promotions, most of the friends will set activity goals before the event and break them down to every hour every day, but there are a lot of time-dividing data, so manual calculation is inconvenient. The upgraded activity analysis will use histogram and table to count the activity results in hours.
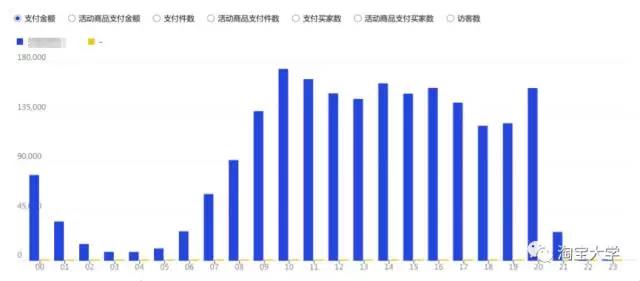
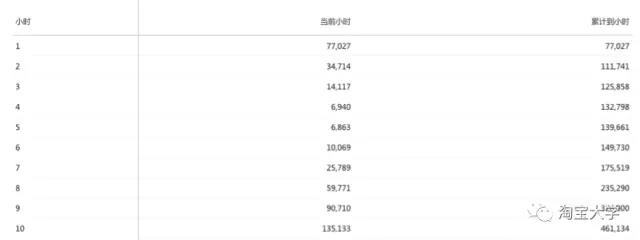
However, activities cannot be done by monitoring every hour. The real time-division analysis must be based on the comparison of activities of the same scale in order to find the shortcomings and adjust and respond in a timely manner.
In addition to providing hourly monitoring, the upgraded activity analysis also supports multiple activity time-division comparisons. As an example, blue is the current activity in progress. If the goal of this activity is to promote sales of 1 million, then we can find the last event of the same size for comparison (yellow part). In other words, to achieve the 1 million target, we must at least ensure that various indicators lead or remain the same as the last event during different periods. If the data falls behind in a certain period of time, you can find it immediately and adjust it immediately. This function must be used especially during Double 11!
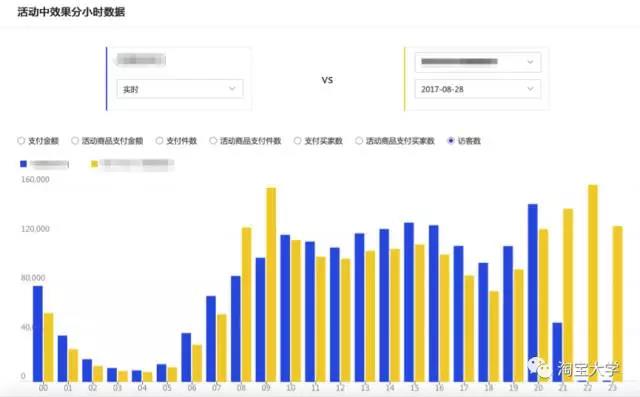
It not only lets you know how much activity data is, but also lets you know where there are shortcomings. This is what the new version of the event analysis hopes to help everyone. Of course, in addition to the bar chart, multiple activity comparisons will also provide table-like horizontal comparisons to facilitate better comparisons.
Upgrade highlight three: The product inventory monitoring is fine to the SKU granularity, and can monitor up to tens of thousands of SKUs.
Access path: Business Staff - War Room - Activity Analysis - Product Inventory
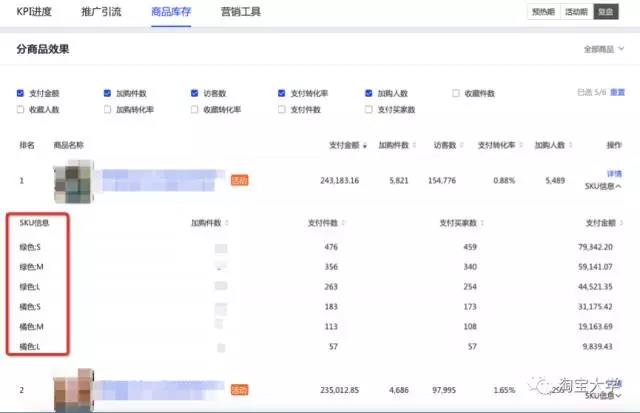
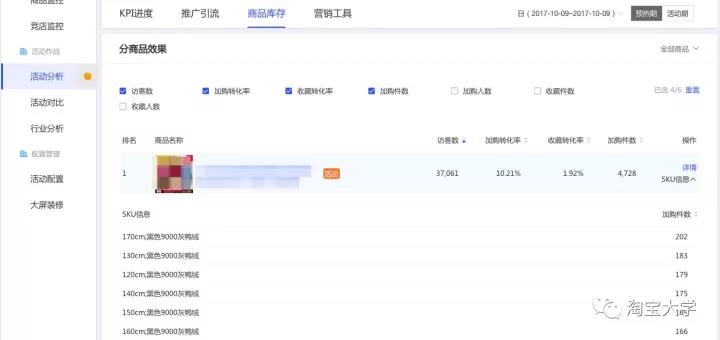
The previous product effect data told you more about the shopping collection or payment status of each product, but dear ones know that during the event, inventory monitoring is often refined to the SKU dimension. Therefore, with the analysis and upgrading of this event, the product effect monitoring has added SKU monitoring at different stages, which can support data monitoring of more than 10,000 SKUs from 2,000 merchants.
During the future period, whether it is the warm-up period or the activity period, which SKU is the most popular, and is most likely to be out of stock and code, and the most need to replenish and transfer goods in time. You can discover and respond in time through this.
The above are just the highlights of the upgrade of "Activity Analysis" this year! To facilitate your understanding of what the activity analysis module contains, we will give you an overview below!
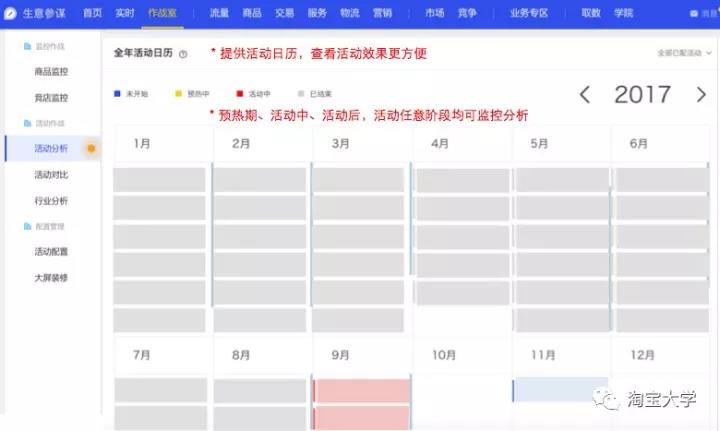
Event Analysis - Home Page: Mainly provides an event calendar event list to facilitate merchants to quickly find corresponding events; activity status includes four states: not started, warm-up, event, and ended. The last three states support clicks, expand to learn about the data details of each stage of the event.
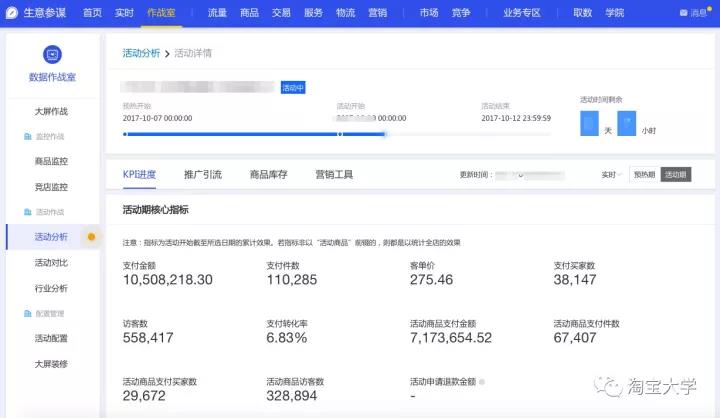
Activity Analysis - Activity Details: Activity Details can monitor data for 3 activity stages, including warm-up period, activity period and review period. The event details mainly provide four aspects of data, namely KPI progress, promotion and traffic, product inventory, and marketing tools. Through the above 3 data, you can keep abreast of the progress of the event, activity traffic, products and marketing results at any time, and respond to any problems at any time.
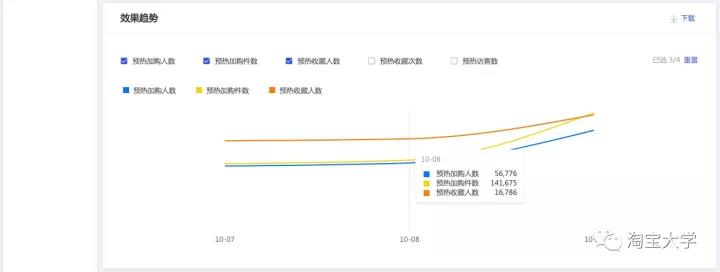
The KPI progress includes core activity indicators (payment amount, number of payments, etc.), core goal completion degree, activity effect data, multiple activity time-sharing comparison, and effect trends; among them, during Double 11, it is necessary to make time-sharing comparison of activity effects. As mentioned above, this function can help you estimate the day's activity effect and quickly discover shortcomings.
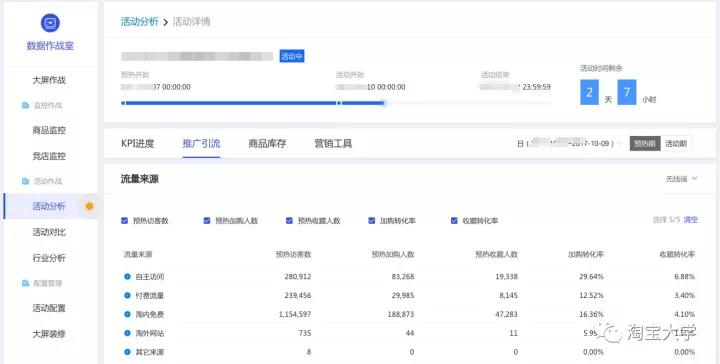
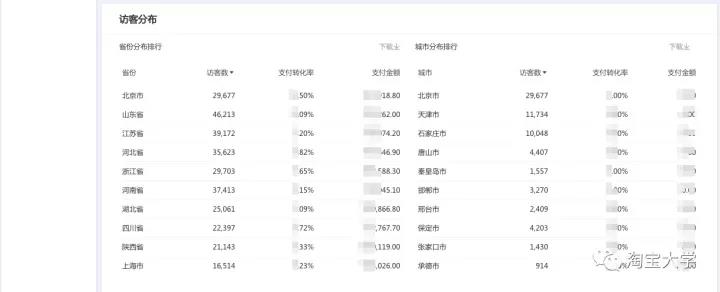
Promotion and traffic mainly provides the main sources of store traffic and the number of visitors from corresponding sources, the number of additional purchases and collections, and the conversion rate of additional purchases and collections. In addition, it also provides the distribution of provinces and cities of different visitors, which can help you quickly understand which channel contributes well to the event and which channel does not meet expectations, and adjust and respond as soon as possible; if there are unexpected "dark horse" channels, you can invest immediately.
Product inventory mainly provides the inventory status of product SKUs in the store ranking, and can support data monitoring of more than 10,000 SKUs from up to 2,000 merchants. The most feared thing about the big promotion is that it suddenly cuts code and goods. This function can help everyone!
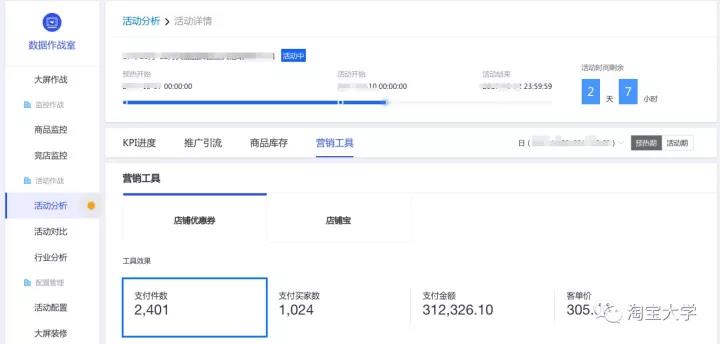
Marketing tools mainly provide conversion data for the "Three Treasures and One Voucher", including the number of payment items, number of payers, payment amount, unit price, etc. brought by the corresponding tools.
Finally, I would like to emphasize that the active combat module is only part of the function of the data combat room. The data combat room also includes nearly 10 combat large screens and 2 types of real-time monitoring (product monitoring and competitive store monitoring), with many functions and waiting for you to experience. (Source: Taobao University)
Thank you for your attention and support to Laogao E-commerce Club . Please indicate the source of the reprinting website www.shxuanming.net
Click to register to apply for the qualification to attend the Laogao e-commerce classroom. Laogao strongly invites e-commerce veterans to teach everyone step by step, increase their popularity and create a hot product, and occupy the first place in the category !


![#Laogao E-commerce Newsletter# [E-commerce Evening News on January 2]](/update/1514884133l984911557.jpg)

![#Laogao E-commerce Newsletter# [E-commerce Morning News on August 24]](/update/1598231318l595271374.jpg)

 EN
EN CN
CN
