Today, the editor of Laogao Crown Club will tell you about the revision of the business consultant. In fact, for sellers, every change is an opportunity for you to catch up with other sellers. Therefore, you must understand and execute as soon as possible. Overtaking is always on the corner, or a new track appears.
Today I am talking to all sellers about the content of the "Commodity" section of the business consultant. The data in this section is also very important to sellers. Understanding this data can give us a good understanding of all of us. In this way, we can optimize our baby composition. The specific content of the section is as follows:
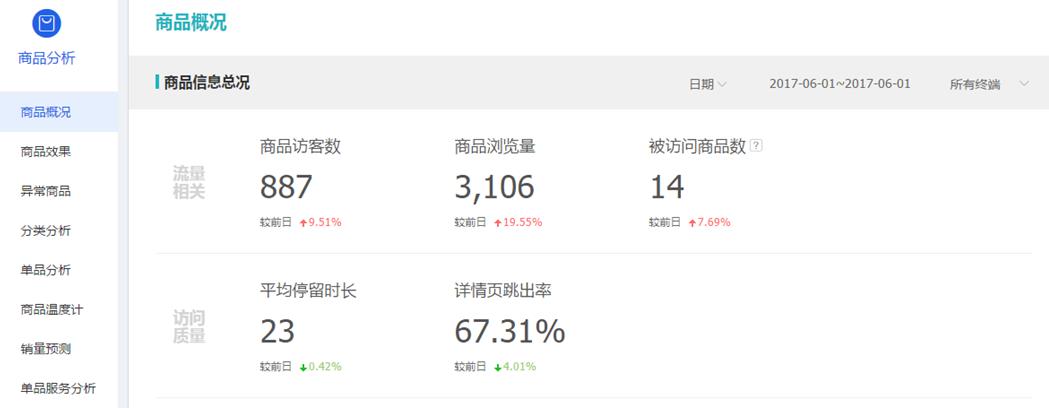
This section consists of several modules such as product profile, product effect, abnormal products, classification analysis, single product analysis, product thermometer, sales forecast, single product service analysis, etc. Compared with the previous data, there are more of the following three modules. Let’s take a look at the data for each item in detail.
1. Product Overview
This module includes three parts: product information summary, product sales trend, and product ranking overview.
1. Product Overview
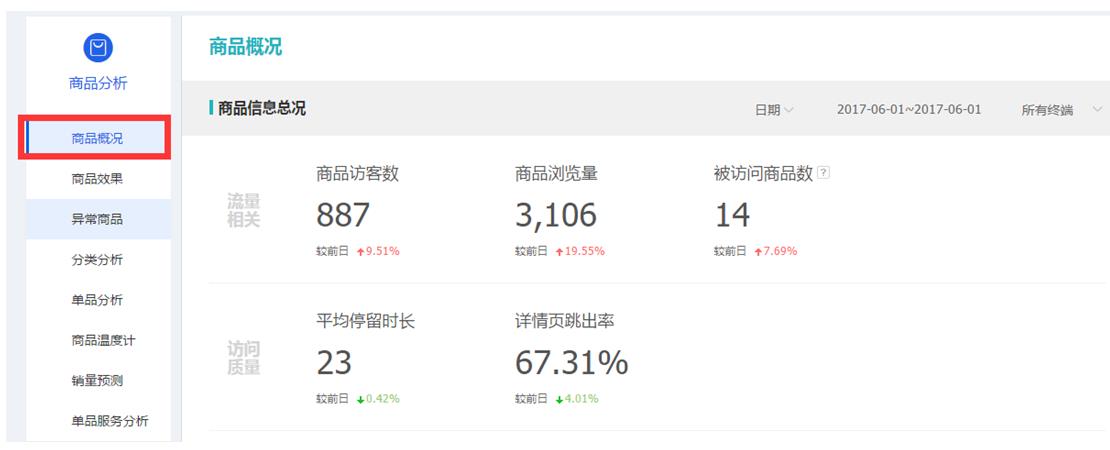
The cycles we can choose are one day, seven days, or thirty days, and we can compare them with any day before to see our data changes. This way, we can intuitively see the changes in our store from the data and then respond accordingly.
And he will give a seven-day data interpretation, as follows:
Traffic correlation analysis:
Traffic-related analysis is bad! The traffic is falling, and only 99.06% of visitors to the store go to the product details page, which is lower than the average of peers. It’s really a matter of ice and fire. You shouldn’t go to the traffic map immediately to understand in-depth, impose traffic drainage, and use product thermometers to diagnose factors that affect the product. Be a good shopping guide and take action quickly.
Access quality analysis:
Not bad, the product details page can retain customers better than the average of peers, please continue to pay attention.
Conversion effect analysis:
Not bad, the conversion rates of additional purchases and payments are higher than those of peers, please continue to pay attention.
Although it is not very accurate, you can refer to it and optimize our store accordingly.
2. Product sales trends
Below is the product sales trend below. The sales trend curve has the following data to choose from, with up to 4 items available for each time. Through the trend of data, we can also find out the problem with our store. Of course, the data in this area must be compared with the market traffic to determine whether it is your own problem or the market environment.
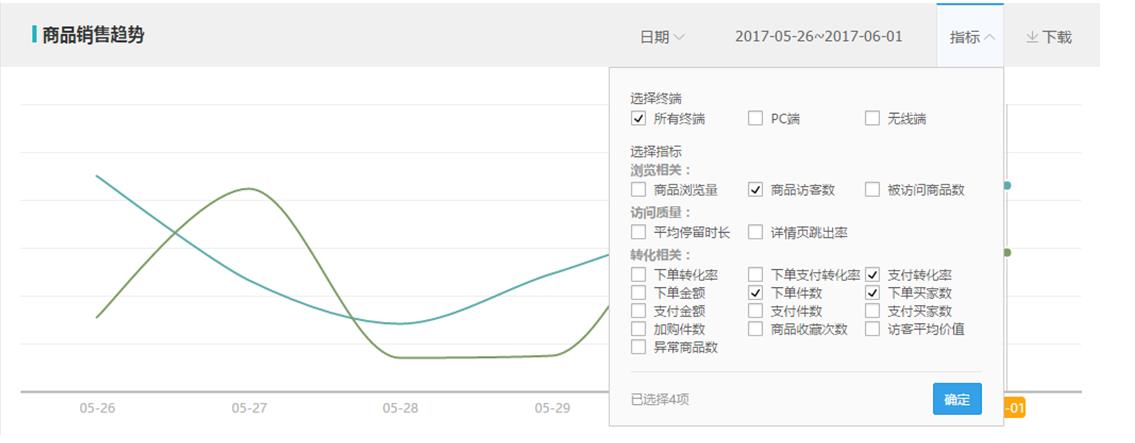
3. Product ranking overview
Below is the product ranking overview. Here we can look at the top of the payment amount ranking and the top of the number of visitors ranking, and we can look at the PC and mobile terminals respectively. The data in this section includes: number of visitors, number of views, bounce rate of details pages, order conversion rate, payment amount, number of payment items, etc. From this, we can judge which one can make our traffic and which one can make our profit. Then we can also click on the item analysis behind the product and jump to the corresponding item analysis page.

2. Product effect
I think the data in this section is very important because we can read out many of our baby’s problems. Look at the picture below:
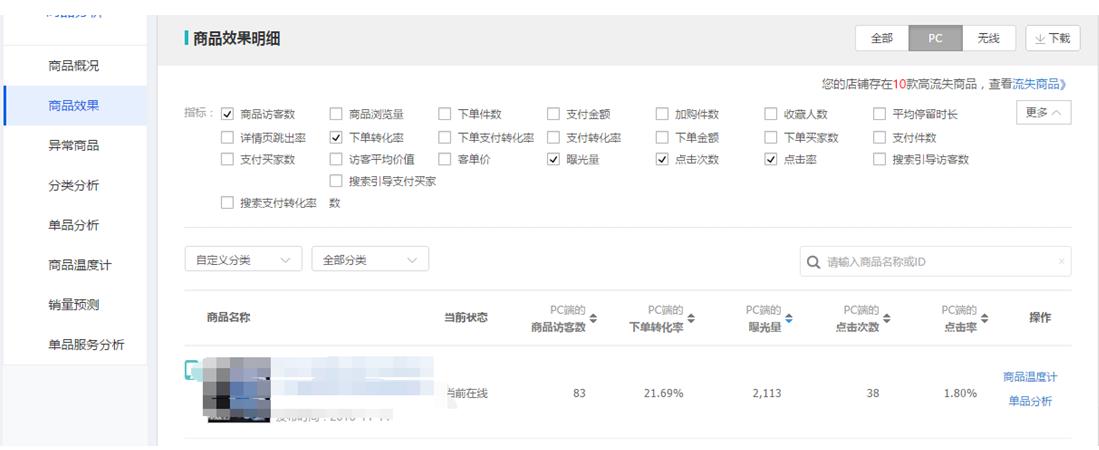
The data we choose here are the number of product visitors, order conversion rate, exposure, clicks, and click rates. Then select the last 7 days in the cycle. Why choose the data for the last 7 days? Because the data for one day is too accidental, and the data for 30 days is relatively poor in time, so the data for the last 7 days are selected. Such data is the most valuable. When choosing a PC side data, many people will ask when seeing this, the current traffic is basically wireless, so why do you still need to choose PC side data? Because the three data of exposure, click times, and click rate are only available on the PC side now, but under big data, they are also referenceable.
Let’s analyze the data as above:
If there is exposure but no traffic, then the optimization we need is your main image;
If you have traffic but no conversion, what you need to consider is price, details page, comments and other factors.
As shown in the first baby picture above, it is clearly shown hundreds of times, hundreds of customers have seen you, but no one clicked the link, which means that your baby must have a problem, and the possibility of problems in the main picture is well-known.
This is just a function of this piece of data, and there are many more that you can explore.
III. Abnormal products
This data includes six data including traffic decline, low payment conversion rate, high bounce rate, payment decline, zero payment, and low inventory. It provides the TOP50 of various abnormal products, and there may be multiple abnormalities in one product. If this happens, you should focus on analyzing the problem and then optimizing it.
Let’s take the example of payment decline, see the following figure:

As you can see, he will give certain suggestions, as mentioned in the picture above:
Payment fell goods: The payment amount in the past 7 days (2017.05.26~2017.06.01) fell by more than 30% compared with the previous 7 days (2017.05.19~2017.05.25);
Suggestions: Optimize product titles and descriptions, strengthen traffic diversion, and at the same time use promotional offers to increase buyer order conversions.
Of course, the suggestions are relatively general, but they give novices a certain direction and do not modify them blindly.
IV. Classification analysis
Here we can see that the products in our store have high traffic and high conversion, and the traffic is low and the conversion is low. Useless categories and products can be deleted and investment in high-converted products can be increased.
5. Single product analysis
How effective is the single item? Which source attracts high quality visitors? Which keyword has high conversion? Which region has strong traffic? Single product analysis can help you. Taobao’s slogan for this function is: pay attention to single products and create hot products!
It has the following four functions.

1. Source destination: This function is to analyze the quality of visitors from the source of the drainage, the conversion effect of the keywords, and the contribution of the source product, so that you can clearly understand the source effect of the drainage.
2. Sales analysis: This function allows you to understand the changing trends of products, master the rules, cater to changes, and improve conversion rates.
3. Visitor characteristics: This function allows you to understand the potential demand characteristics of the product visitors, cater to the needs, and let visitors buy and make you enjoy money.
4. Promotional analysis: This function can quantify the product effect, help you revitalize store traffic and promote visitors to buy more. Moreover, Taobao will select products suitable for related matching for you to choose based on previous data analysis.
Below is the keyword effect analysis, where we can see the various indicators of our entry words. We can make corresponding optimizations.

VI. Product thermometer
Taobao gave it the slogan: Product thermometer, one-click to take the pulse!
Its main functions are as follows:
1. Quantitative conversion rate Quantitative product conversion rate, so that you can understand what problems exist in the conversion process.

2. Interpret the conversion effect data of single product and give priority to which locations exist. Then diagnose your store from multiple angles such as page performance, title, attributes, promotional shopping guides, and descriptions, and provide diagnosis and treatment methods. You can refer to this.
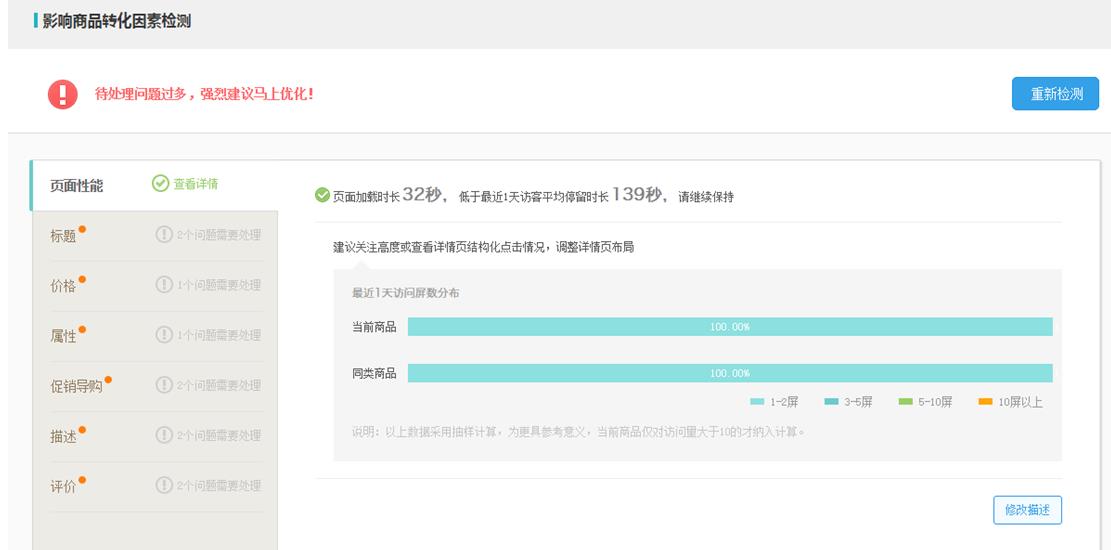
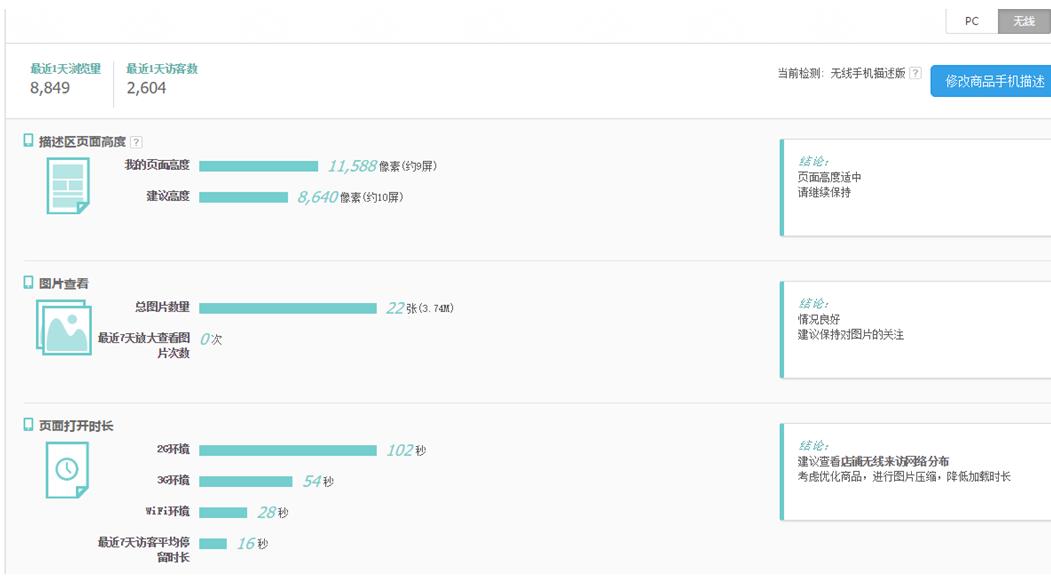
3. The wireless terminal is diagnosed from three angles: page height, picture viewing, and page opening time, providing you with corresponding solutions. If you need to modify, you can click on the mobile phone description of the product on the right.
7. Sales volume forecast
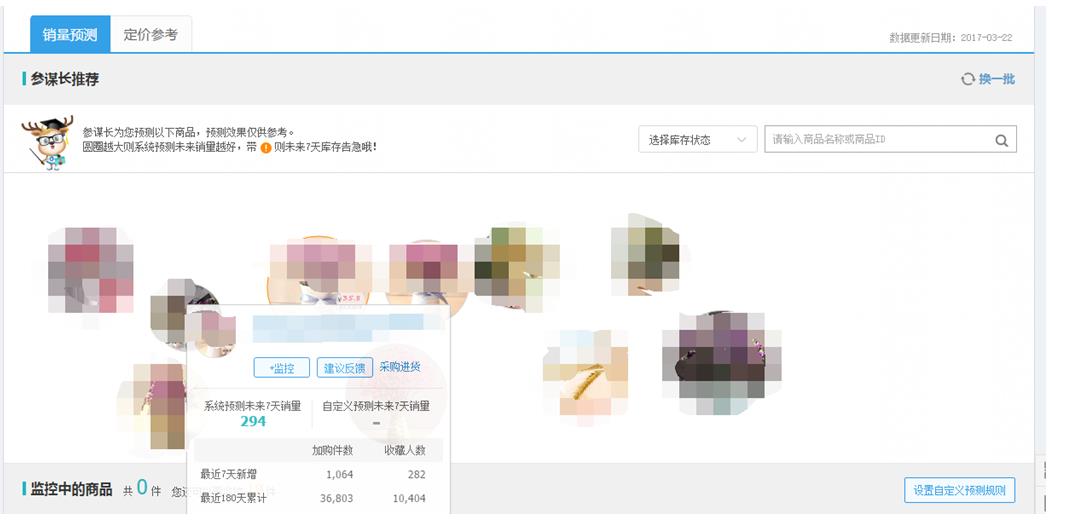
This buyer is a very good feature for big sellers. Its main function is to predict the recent sales volume of the following products (the forecast effect is for reference only). The larger the circle, the better the system predicts future sales. This is of great help to our recommendation of styles and to ensure inventory.
8. Single product service analysis
This indicator is very important. It allows us to know which single item buyer prefers it? Which single item buyer has the worst satisfaction? How does the buyer say about this item? Are you particularly dissatisfied with which color or specification? We can clearly see the refund rate, quality refund rate, dispute recommendation rate of our single products, and we can also see the comparison with the average value of our peers.

We can also see the trends of various data, statistics on the reasons for refunds, and analysis of evaluation content. These indicators are of great guiding role in the optimization and quality of our services.
Thank you for your attention and support to Laogao Crown Club . Please indicate the source of the reprinting website www.shxuanming.net
Click to register to apply to join the well-known e-commerce network - Laogao Crown Club. Any merchants from all over the country, Tmall merchants, Taobao Crown Stores, Jinguan Stores, and other e-commerce platform merchants can apply to join!
